How metrics streaming works
Each node running Netdata can stream the metrics it collects, in real time, to another node. Streaming allows you to replicate metrics data across multiple nodes, or centralize all your metrics data into a single time-series database (TSDB).
When one node streams metrics to another, the node receiving metrics can visualize them on the dashboard, run health checks to trigger alarms and send notifications, and export all metrics to an external TSDB. When Netdata streams metrics to another Netdata, the receiving one is able to perform everything a Netdata instance is capable of.
Streaming lets you decide exactly how you want to store and maintain metrics data. While we believe Netdata's distributed architecture is ideal for speed and scale, streaming provides centralization options for those who want to maintain only a single TSDB instance.
Streaming basics#
There are three types of nodes in Netdata's streaming ecosystem.
- Parent: A node, running Netdata, that receives streamed metric data.
- Child: A node, running Netdata, that streams metric data to one or more parent.
- Proxy: A node, running Netdata, that receives metric data from a child and "forwards" them on to a separate parent node.
Netdata uses API keys, which are just random GUIDs, to authorize the communication between child and parent nodes. We
recommend using uuidgen for generating API keys, which can then be used across any number of streaming connections.
Or, you can generate unique API keys for each parent-child relationship.
Once the parent node authorizes the child's API key, the child can start streaming metrics.
It's important to note that the streaming connection uses TCP, UDP, or Unix sockets, not HTTP. To proxy streaming metrics, you need to use a proxy that tunnels OSI layer 4-7 traffic without interfering with it, such as SOCKS or Nginx's TCP/UDP load balancing.
Supported streaming configurations#
Netdata supports any combination of parent, child, and proxy nodes that you can imagine. Any node can act as both a parent, child, or proxy at the same time, sending or receiving streaming metrics from any number of other nodes.
Here are a few example streaming configurations:
- Headless collector:
- Child
A, without a database or web dashboard, streams metrics to parentB. Ametrics are only available via the local Agent dashboard forB.Bgenerates alarms forA.
- Child
- Replication:
- Child
A, with a database and web dashboard, streams metrics to parentB. Ametrics are available on both local Agent dashboards, and can be stored with the same or different metrics retention policies.- Both
AandBgenerate alarms.
- Child
- Proxy:
- Child
A, with or without a database, sends metrics to proxyC, also with or without a database.Csends metrics to parentB. - Any node with a database can generate alarms.
- Child
Viewing streamed metrics#
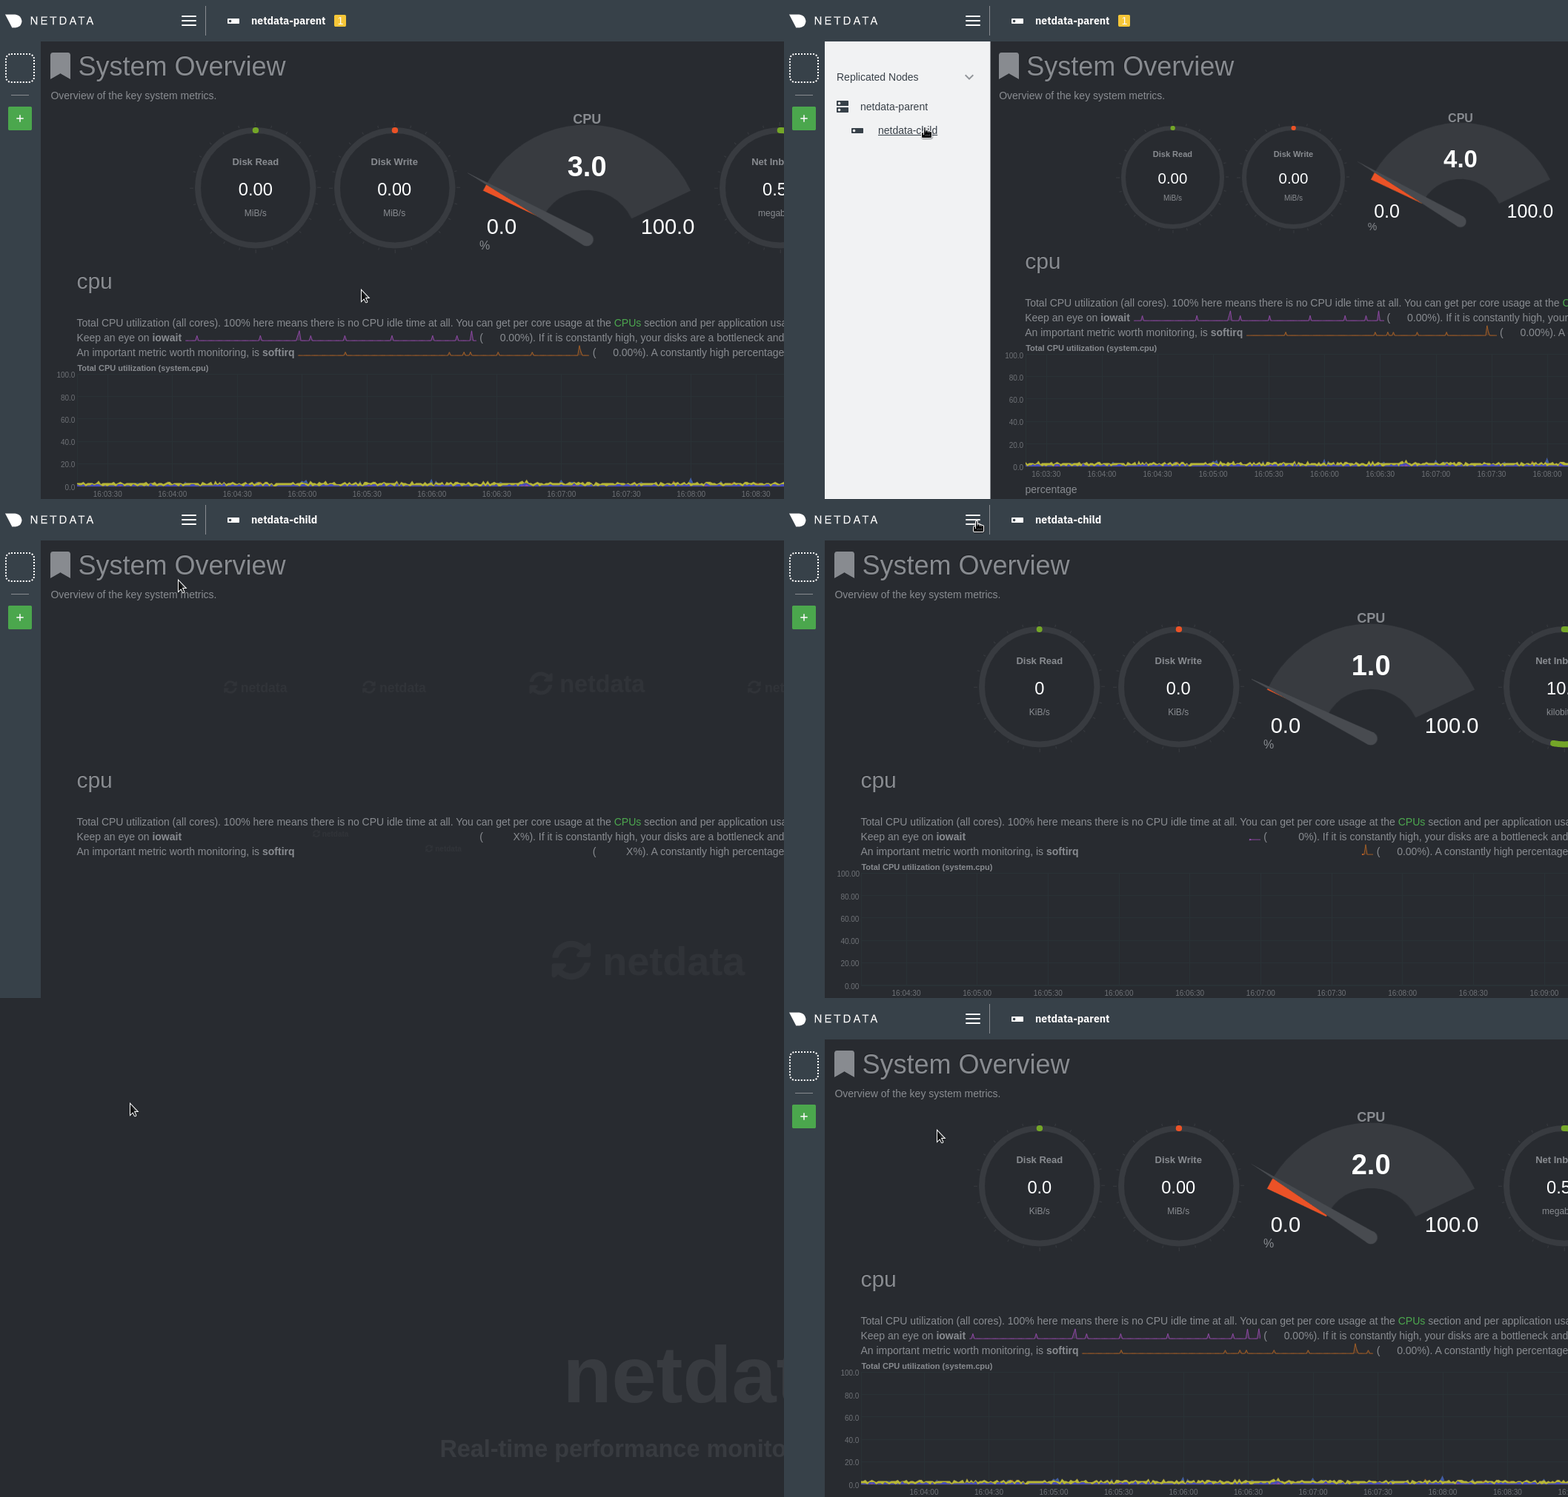
Parent nodes feature a Replicated Nodes section in the left-hand panel, which opens with the hamburger icon
in the top navigation. The parent node, plus any child nodes, appear here. Click on any of the hostnames to switch
between parent and child dashboards, all served by the parent's web server.

Each child dashboard is also available directly at the following URL pattern:
http://PARENT-NODE:19999/host/CHILD-HOSTNAME.
What's next?#
Now that you understand the fundamentals of streaming metrics between nodes, go ahead and enable
streaming using a simple parent-child relationship. For all
the details, see the streaming reference doc.
Take your streaming setup even further by exporting metrics to an external TSDB.