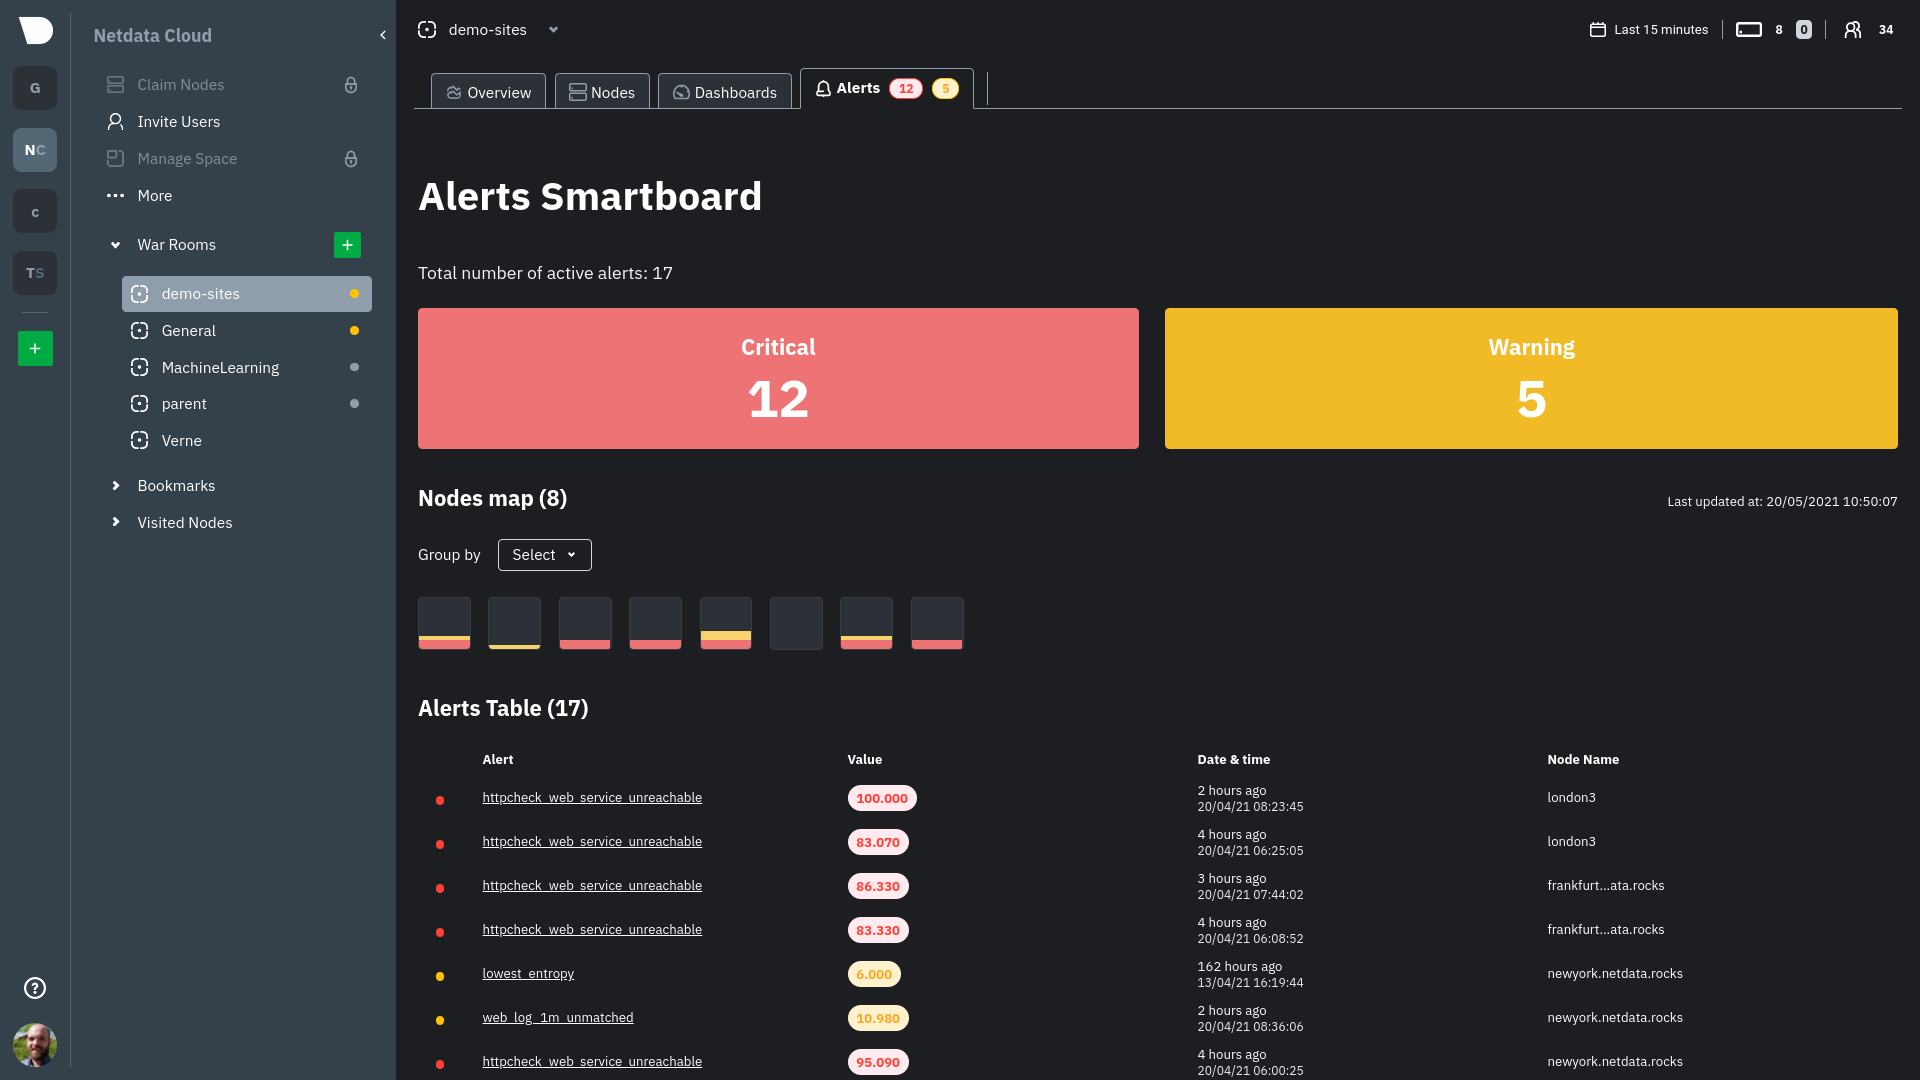
Alert Smartboard
The Alerts Smartboard gives you a high level of availability and performance information for every node you're monitoring with Netdata Cloud. We expect it to become the "home base" for many Netdata Cloud users who want to instantly understand what's going on with their infrastructure and exactly where issues might be.
The Smartboard is available entirely for free to all users and for any number of nodes.
Active alerts#
The two large boxes show you exactly how many critical and warning alerts are active across your nodes. Click on either column to filter the nodes map and alerts table for only that type of alert.
Nodes map#
The nodes map puts each node into a separate box and displays the number of critical and warning alerts.
Hover over any box on the map to reveal a popup with the node's name and the name, value, and timestamp for each active alert. Click on any box to filter the alerts table for that node only.
Click on any of the alert names to see the alert in context with the chart and dimension that triggered it.

The nodes map can also can also be filtered by severity and operating system type.
Alerts table#
The alerts table shows all active alerts in your War Room, including the alert's name, the most recent value, a timestamp of when it became active, and the relevant node.
Click on any of the alert names to see the alert in context with the chart and dimension that triggered it.
