eBPF monitoring with Netdata
Netdata's extended Berkeley Packet Filter (eBPF) collector monitors kernel-level metrics for file descriptors, virtual filesystem IO, and process management on Linux systems. You can use our eBPF collector to analyze how and when a process accesses files, when it makes system calls, whether it leaks memory or creating zombie processes, and more.
Netdata's eBPF monitoring toolkit uses two custom eBPF programs. The default, called entry, monitors calls to a
variety of kernel functions, such as do_sys_open, __close_fd, vfs_read, vfs_write, _do_fork, and more. The
return program also monitors the return of each kernel functions to deliver more granular metrics about how your
system and its applications interact with the Linux kernel.
eBPF monitoring can help you troubleshoot and debug how applications interact with the Linux kernel. See our guide on troubleshooting apps with eBPF metrics for configuration and troubleshooting tips.
Enable the collector on Linux#
The eBPF collector is installed and enabled by default on most new installations of the Agent. The eBPF collector does not currently work with static build installations, but improved support is in active development.
eBPF monitoring only works on Linux systems and with specific Linux kernels, including all kernels newer than 4.11.0,
and all kernels on CentOS 7.6 or later.
If your Agent is v1.22 or older, you may to enable the collector yourself. See the configuration section for details.
Charts#
The eBPF collector creates an eBPF menu in the Agent's dashboard along with two sub-menus: Socket, and Process. The plugin also creates charts on different menus, like System Overview, Memory, Disks, Filesystem, Mount Points and Applications. All the charts in this section update every second.
The collector stores the actual value inside of its process, but charts only show the difference between the values collected in the previous and current seconds.
System overview#
Not all charts within the System Overview menu are enabled by default, because they add around 100ns overhead for each function call, this number is small for a human perspective, but the functions are called many times creating an impact on host. See the configuration section for details about how to enable them.
Swap#
Inside the swap submenu the eBPF plugin creates the chart swapcalls; this chart is displaying when processes are calling
functions swap_readpage and swap_writepage, which are functions responsible for doing IO in swap memory.
Memory#
In the memory submenu the eBPF plugin creates two submenus page cache and synchronization with the following organization:
- Page Cache
- Page cache ratio
- Dirty pages
- Page cache hits
- Page cache misses
- Synchronization
- File sync
- Memory map sync
- File system sync
- File range sync
Page cache ratio#
The chart cachestat_ratio shows how processes are accessing page cache. In a normal scenario, we expect values around
100%, which means that the majority of the work on the machine is processed in memory. To calculate the ratio Netdata
monitors calls for kernel functions add_to_page_cache_lru, mark_page_accessed, account_page_dirtied, and
mark_buffer_dirty.
Dirty pages#
On cachestat_dirties Netdata demonstrates the number of pages that were modified. This chart shows the number of calls
to the function mark_buffer_dirty.
Page cache hits#
A page cache hit is when the page cache is successfully accessed with a read operation. We do not count pages that were added relatively recently.
Page cache misses#
A page cache miss means that a page was not inside memory when the process tried to access it. This chart shows the result
of the difference for calls between functions add_to_page_cache_lru and account_page_dirtied.
File sync#
This chart shows calls to synchronization methods, fsync(2) and fdatasync(2), to transfer all modified page caches
for the files on disk devices. These calls block until the disk reports that the transfer has been completed. They flush
data for specific file descriptors.
Memory map sync#
The chart shows calls to msync(2) syscalls. This syscall flushes changes to a file that was mapped into memory using
mmap(2).
File system sync#
This chart monitors calls demonstrating commits from filesystem caches to disk.
File range sync#
This chart shows calls to sync_file_range(2) which synchronizes file segments with disk. This is the most dangerous
syscall to synchronize data according to its manual.
Disk#
The eBPF plugin also shows a chart in the Disk section when the disk thread is enabled. This will create the
chart disk_latency_io for each disk on the host. These charts use tracepoints
block:block_rq_issue and block:block_rq_complete to measure the latency of IO events.
Filesystem#
This group has two charts demonstrating how applications interact with the Linux kernel to open and close file descriptors.
File descriptor#
This chart contains two dimensions that show the number of calls to the functions do_sys_open and __close_fd. Most
software doesn't commonly call these functions directly, they are behind the system calls open(2), openat(2),
and close(2).
File error#
This chart shows the number of times some software tried and failed to open or close a file descriptor.
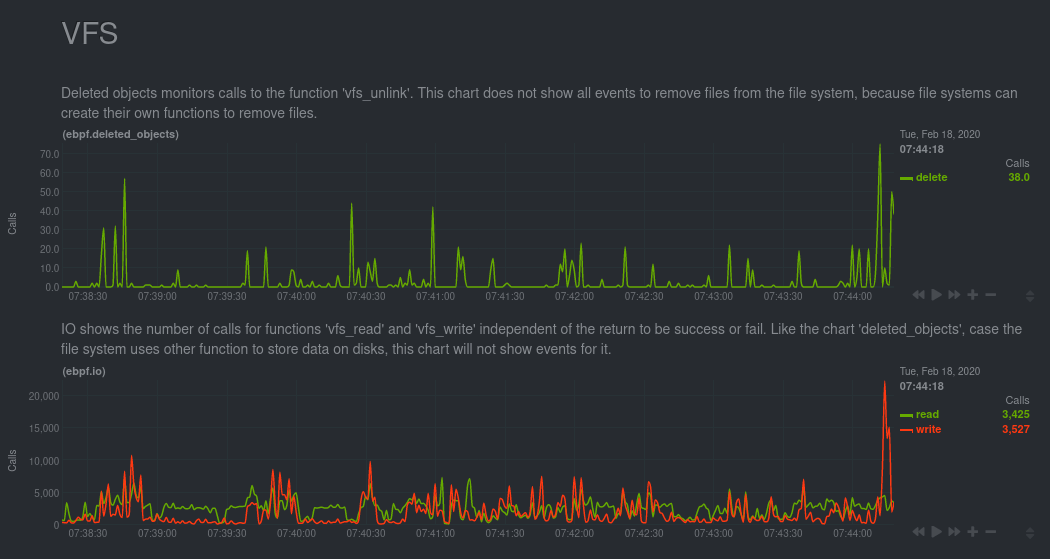
VFS#
A virtual file system (VFS) is a layer on top of regular filesystems. The functions presented inside this API are not used for filesystems, so it's possible that the charts in this section won't show all the actions that occurred on your system.
Deleted objects#
This chart monitors calls to vfs_unlink. This function is responsible for removing objects from the file system.
IO#
This chart shows the number of calls to the functions vfs_read and vfs_write.
IO bytes#
This chart also monitors vfs_read and vfs_write but, instead of the number of calls, it shows the total amount of
bytes read and written with these functions.
The Agent displays the number of bytes written as negative because they are moving down to disk.
IO errors#
The Agent counts and shows the number of instances where a running program experiences a read or write error.
Create#
This chart shows the number of calls to vfs_create. This function is responsible for creating files.
Synchronization#
This chart shows the number of calls to vfs_fsync. This function is responsible for calling fsync(2) or
fdatasync(2) on a file. You can see more details in the Synchronization section.
Open#
This chart shows the number of calls to vfs_open. This function is responsible for opening files.
eBPF#
Process thread#
Internally, the Linux kernel treats both processes and threads as tasks. To create a thread, the kernel offers a few
system calls: fork(2), vfork(2), and clone(2). In turn, each of these system calls uses either the function
_do_fork (kernel older than 5.10.0) or the function do_fork (latest kernels). To generate this chart, the eBPF
collector monitors the cited functions to populate the process dimension, and monitors sys_clone to identify threads.
Exit#
Ending a task requires two steps. The first is a call to the internal function do_exit, which notifies the operating
system that the task is finishing its work. The second step is to release the kernel information with the internal
function release_task. The difference between the two dimensions can help you discover
zombie processes.
Task error#
The functions responsible for ending tasks do not return values, so this chart contains information about failures on process and thread creation only.
TCP functions#
This chart demonstrates calls to functions tcp_sendmsg, tcp_cleanup_rbuf, and tcp_close; these functions are
used to send & receive data and to close connections when TCP protocol is used.
TCP bandwidth#
Like the previous chart, this one also monitors tcp_sendmsg and tcp_cleanup_rbuf, but instead of showing the
number of calls, it demonstrates the number of bytes sent and received.
TCP retransmit#
This chart demonstrates calls to function tcp_retransmit that is responsible for executing TCP retransmission when the
receiver did not return the packet during the expected time.
UDP functions#
This chart demonstrates calls to functions udp_sendmsg and udp_recvmsg, which are responsible for sending &
receiving data for connections when the UDP protocol is used.
UDP bandwidth#
Like the previous chart, this one also monitors udp_sendmsg and udp_recvmsg, but instead of showing the
number of calls, it monitors the number of bytes sent and received.
Configuration#
Enable or disable the entire eBPF collector by editing netdata.conf.
To enable the collector, scroll down to the [plugins] section ensure the relevant line references ebpf (not
ebpf_process), is uncommented, and is set to yes.
You can also configure the eBPF collector's behavior by editing ebpf.d.conf.
[global]#
The [global] section defines settings for the whole eBPF collector.
eBPF load mode#
The collector has two different eBPF programs. These programs monitor the same functions inside the kernel, but they monitor, process, and display different kinds of information.
By default, this plugin uses the entry mode. Changing this mode can create significant overhead on your operating
system, but also offer valuable information if you are developing or debugging software. The ebpf load mode option
accepts the following values:
entry: This is the default mode. In this mode, the eBPF collector only monitors calls for the functions described in the sections above, and does not show charts related to errors.return: In thereturnmode, the eBPF collector monitors the same kernel functions asentry, but also creates new charts for the return of these functions, such as errors. Monitoring function returns can help in debugging software, such as failing to close file descriptors or creating zombie processes.update every: Number of seconds used for eBPF to send data for Netdata.pid table size: Defines the maximum number of PIDs stored inside the application hash table.
Integration with apps.plugin#
The eBPF collector also creates charts for each running application through an integration with the
apps.plugin. This integration helps you understand how specific applications
interact with the Linux kernel.
When the integration is enabled, your dashboard will also show the following charts using low-level Linux metrics:
- eBPF file
- Number of calls to open files. (
apps.file_open) - Number of files closed. (
apps.file_closed) - Number of calls to open files that returned errors.
- Number of calls to close files that returned errors.
- Number of calls to open files. (
- eBPF syscall
- Number of calls to delete files. (
apps.file_deleted) - Number of calls to
vfs_write. (apps.vfs_write_call) - Number of calls to
vfs_read. (apps.vfs_read_call) - Number of bytes written with
vfs_write. (apps.vfs_write_bytes) - Number of bytes read with
vfs_read. (apps.vfs_read_bytes) - Number of calls to write a file that returned errors.
- Number of calls to read a file that returned errors.
- Number of calls to delete files. (
- eBPF process
- Number of process created with
do_fork. (apps.process_create) - Number of threads created with
do_forkor__x86_64_sys_clone, depending on your system's kernel version. (apps.thread_create) - Number of times that a process called
do_exit. (apps.task_close)
- Number of process created with
- eBPF net
- Number of bytes sent. (
apps.bandwidth_sent) - Number of bytes received. (
apps.bandwidth_recv)
- Number of bytes sent. (
If you want to disable the integration with apps.plugin along with the above charts, change the setting apps to
no.
When the integration is enabled, eBPF collector allocates memory for each process running. The total
allocated memory has direct relationship with the kernel version. When the eBPF plugin is running on kernels newer than 4.15,
it uses per-cpu maps to speed up the update of hash tables. This also implies storing data for the same PID
for each processor it runs.
Integration with cgroups.plugin#
The eBPF collector also creates charts for each cgroup through an integration with the
cgroups.plugin. This integration helps you understand how a specific cgroup
interacts with the Linux kernel.
The integration with cgroups.plugin is disabled by default to avoid creating overhead on your system.
If you want to enable the integration with cgroups.plugin, change the cgroupssetting to
yes.
If you do not need to monitor specific metrics for your cgroups, you can enable cgroups inside
ebpf.d.conf, and then disable the plugin for a specific thread by following the steps in the
'Configuration` section
[ebpf programs]#
The eBPF collector enables and runs the following eBPF programs by default:
fd: This eBPF program creates charts that show information about calls to open files.mount: This eBPF program creates charts that show calls to syscalls mount(2) and umount(2).shm: This eBPF program creates charts that show calls to syscalls shmget(2), shmat(2), shmdt(2) and shmctl(2).sync: Montitor calls to syscalls sync(2), fsync(2), fdatasync(2), syncfs(2), msync(2), and sync_file_range(2).network viewer: This eBPF program creates charts with information aboutTCPandUDPfunctions, including the bandwidth consumed by each.vfs: This eBPF program creates charts that show information about VFS (Virtual File System) functions.process: This eBPF program creates charts that show information about process life. When inreturnmode, it also creates charts showing errors when these operations are executed.hardirq: This eBPF program creates charts that show information about time spent servicing individual hardware interrupt requests (hard IRQs).softirq: This eBPF program creates charts that show information about time spent servicing individual software interrupt requests (soft IRQs).oomkill: This eBPF program creates a chart that shows OOM kills for all applications recognized via theapps.pluginintegration. Note that this program will show application charts regardless of whether apps integration is turned on or off.
You can also enable the following eBPF programs:
cachestat: Netdata's eBPF data collector creates charts about the memory page cache. When the integration withapps.pluginis enabled, this collector creates charts for the whole host and for each application.dcstat: This eBPF program creates charts that show information about file access using directory cache. It appendskprobesforlookup_fast()andd_lookup()to identify if files are inside directory cache, outside and files are not found.disk: This eBPF program creates charts that show information about disk latency independent of filesystem.filesystem: This eBPF program creates charts that show information about some filesystem latency.swap: This eBPF program creates charts that show information about swap access.
Thread configuration#
You can configure each thread of the eBPF data collector by editing either the cachestat.conf, process.conf,
or network.conf files. Use edit-config from your Netdata config directory:
Configuration files#
The following configuration files are available:
cachestat.conf: Configuration for thecachestatthread.dcstat.conf: Configuration for thedcstatthread.disk.conf: Configuration for thediskthread.fd.conf: Configuration for thefile descriptorthread.filesystem.conf: Configuration for thefilesystemthread.hardirq.conf: Configuration for thehardirqthread.process.conf: Configuration for theprocessthread.network.conf: Configuration for thenetwork viewerthread. This config file overwrites the global options and also lets you specify which network the eBPF collector monitors.softirq.conf: Configuration for thesoftirqthread.sync.conf: Configuration for thesyncthread.vfs.conf: Configuration for thevfsthread.
Network configuration#
The network configuration has specific options to configure which network(s) the eBPF collector monitors. These options are divided in the following sections:
[network connections]#
You can configure the information shown on outbound and inbound charts with the settings in this section.
When you define a ports setting, Netdata will collect network metrics for that specific port. For example, if you
write ports = 19999, Netdata will collect only connections for itself. The hostnames setting accepts
simple patterns. The ports, and ips settings accept negation (!) to
deny specific values or asterisk alone to define all values.
In the above example, Netdata will collect metrics for all ports between 1 and 443, with the exception of 53 (domain) and 145.
The following options are available:
ports: Define the destination ports for Netdata to monitor.hostnames: The list of hostnames that can be resolved to an IP address.ips: The IP or range of IPs that you want to monitor. You can use IPv4 or IPv6 addresses, use dashes to define a range of IPs, or use CIDR values. The default behavior is to only collect data for private IP addresses, but this can be changed with theipssetting.
By default, Netdata displays up to 500 dimensions on network connection charts. If there are more possible dimensions,
they will be bundled into the other dimension. You can increase the number of shown dimensions by changing the maximum
dimensions setting.
The dimensions for the traffic charts are created using the destination IPs of the sockets by default. This can be
changed setting resolve hostname ips = yes and restarting Netdata, after this Netdata will create dimensions using
the hostnames every time that is possible to resolve IPs to their hostnames.
[service name]#
Netdata uses the list of services in /etc/services to plot network connection charts. If this file does not contain the
name for a particular service you use in your infrastructure, you will need to add it to the [service name] section.
For example, Netdata's default port (19999) is not listed in /etc/services. To associate that port with the Netdata
service in network connection charts, and thus see the name of the service instead of its port, define it:
Sync configuration#
The sync configuration has specific options to disable monitoring for syscalls, as default option all syscalls are monitored.
Filesystem configuration#
The filesystem configuration has specific options to disable monitoring for filesystems, by default all filesystems are monitored.
The ebpf program nfsdist monitors only nfs mount points.
Troubleshooting#
If the eBPF collector does not work, you can troubleshoot it by running the ebpf.plugin command and investigating its
output.
You can also use grep to search the Agent's error.log for messages related to eBPF monitoring.
Confirm kernel compatibility#
The eBPF collector only works on Linux systems and with specific Linux kernels. We support all kernels more recent than
4.11.0, and all kernels on CentOS 7.6 or later.
You can run our helper script to determine whether your system can support eBPF monitoring.
If this script returns no output, your system is ready to compile and run the eBPF collector.
If you see a warning about a missing kernel configuration (KPROBES KPROBES_ON_FTRACE HAVE_KPROBES BPF BPF_SYSCALL
BPF_JIT), you will need to recompile your kernel to support this configuration. The process of recompiling Linux
kernels varies based on your distribution and version. Read the documentation for your system's distribution to learn
more about the specific workflow for recompiling the kernel, ensuring that you set all the necessary
Mount debugfs and tracefs#
The eBPF collector also requires both the tracefs and debugfs filesystems. Try mounting the tracefs and debugfs
filesystems using the commands below:
If they are already mounted, you will see an error. You can also configure your system's /etc/fstab configuration to
mount these filesystems on startup. More information can be found in the ftrace documentation.
Performance#
eBPF monitoring is complex and produces a large volume of metrics. We've discovered scenarios where the eBPF plugin significantly increases kernel memory usage by several hundred MB.
If your node is experiencing high memory usage and there is no obvious culprit to be found in the apps.mem chart,
consider testing for high kernel memory usage by disabling eBPF monitoring. Next,
restart Netdata with sudo systemctl restart netdata to see if system
memory usage (see the system.ram chart) has dropped significantly.
Beginning with v1.31, kernel memory usage is configurable via the pid table size setting
in ebpf.conf.
SELinux#
When SELinux is enabled, it may prevent ebpf.plugin from
starting correctly. Check the Agent's error.log file for errors like the ones below:
You can also check for errors related to ebpf.plugin inside /var/log/audit/audit.log:
If you see similar errors, you will have to adjust SELinux's policies to enable the eBPF collector.
Creation of bpf policies#
To enable ebpf.plugin to run on a distribution with SELinux enabled, it will be necessary to take the following
actions.
First, stop the Netdata Agent.
Next, create a policy with the audit.log file you examined earlier.
This will create two new files: netdata_ebpf.te and netdata_ebpf.mod.
Edit the netdata_ebpf.te file to change the options class and allow. You should have the following at the end of
the netdata_ebpf.te file.
Then compile your netdata_ebpf.te file with the following commands to create a binary that loads the new policies:
Finally, you can load the new policy and start the Netdata agent again:
Lockdown#
Beginning with version 5.4, the Linux kernel has
a feature called "lockdown," which may affect ebpf.plugin depending how the kernel was compiled. The following table
shows how the lockdown module impacts ebpf.plugin based on the selected options:
| Enforcing kernel lockdown | Enable lockdown LSM early in init | Default lockdown mode | Can ebpf.plugin run with this? |
|---|---|---|---|
| YES | NO | NO | YES |
| YES | Yes | None | YES |
| YES | Yes | Integrity | YES |
| YES | Yes | Confidentiality | NO |
If you or your distribution compiled the kernel with the last combination, your system cannot load shared libraries
required to run ebpf.plugin.